Chapter 3 Visualizations
3.1 Traffic camera locations
Plotting data on map is easier than you’d think. If you have shapefiles, matplotlib can be used to visualize geographical data.
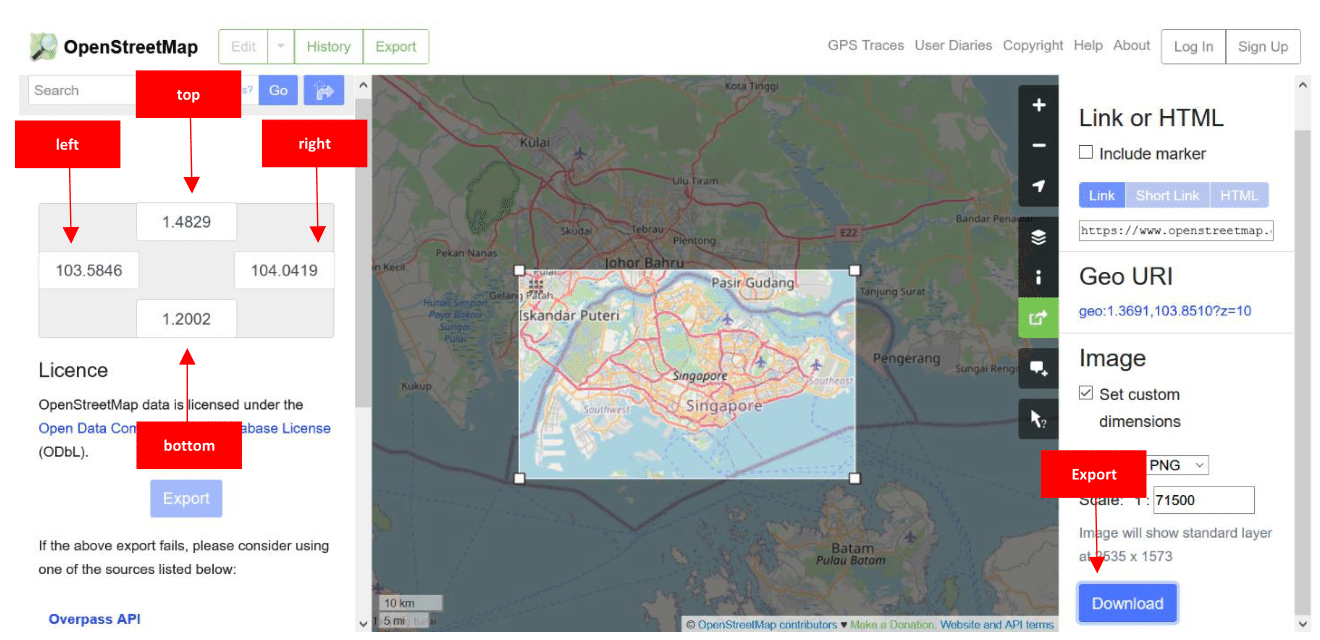
Alternatively, you can download desired maps from opestreetmap.org as images. On the map area, Zoom in and out to have the
desired area bounding box. Take note of your coordinates [left, right, bottom, top].
Let's now import the required libraries as well as the dataset containing the geographical location (lon, lat) of each traffic camera.
# Import libraries
import pandas as pd
import matplotlib.pyplot as plt

# Read csv file from Dropbox as Pandas DataFrame
csv = 'https://www.dropbox.com/s/xfazz0mu1z38buz/Singapore_cameras.csv?dl=1'
cameras =  pd.read_csv(csv,delimiter=',')

# Read the map of Singapore
SG = plt.imread('./Singapore_map.png')
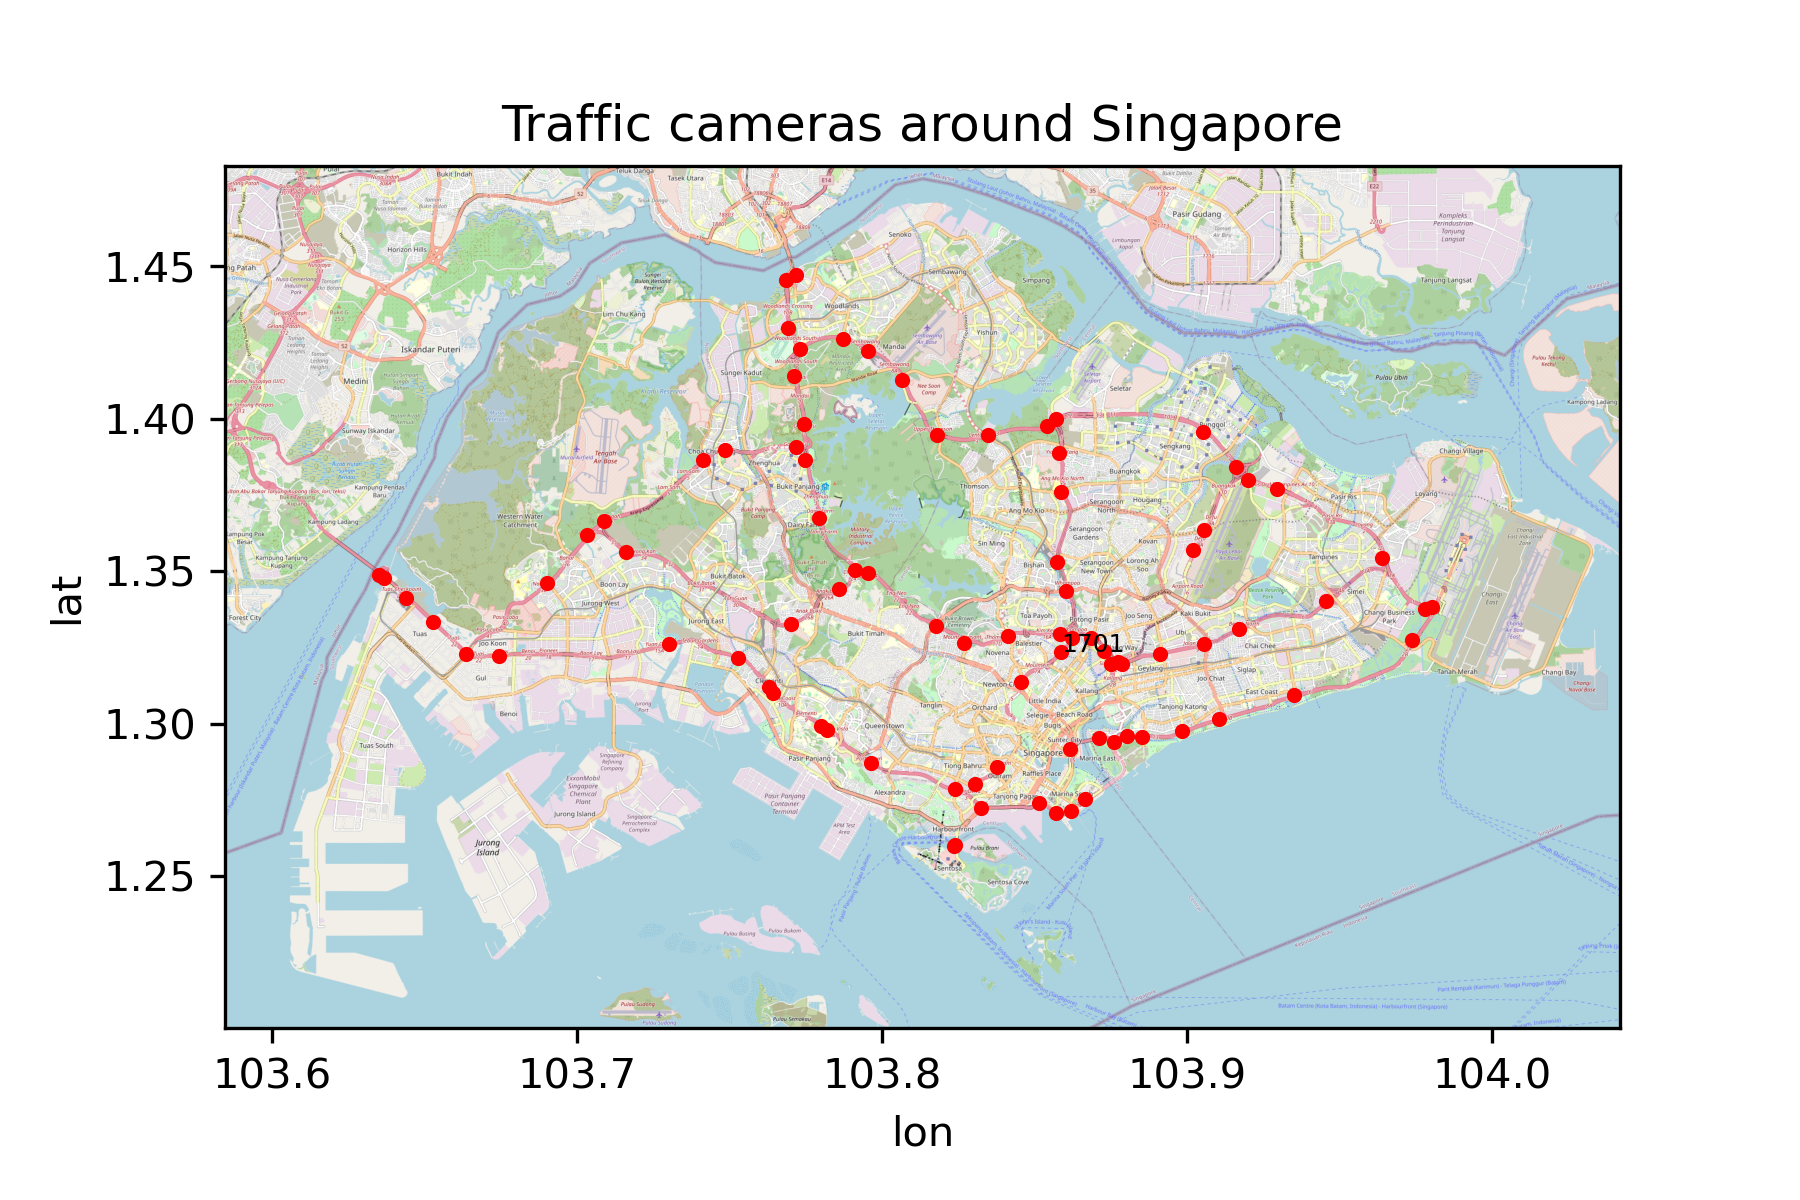
Our goal is to plot all cameras in the map of Singapore. We are going to label camera 1701 only, to see where exactly is located.
# Convert labes of camera_id as string
cameras['camera_id'] = cameras['camera_id'].astype(str)
cameras.loc[cameras['camera_id'] == '1701', 'labels'] = '1701'
cameras.loc[cameras['camera_id'] != '1701', 'labels'] = ''

# Open figure + axis
fig, ax = plt.subplots()
# Add the map of Singapore
# Use the extent keyword of imshow. The order of the argument is [left, right, bottom, top]
plt.imshow(SG, zorder=0, extent=[103.5846, 104.0419, 1.2002, 1.4829])
# plot
ax.scatter(x=cameras['lon'],y=cameras['lat'], color='red')
# set labels
ax.set_xlabel('lon')
ax.set_ylabel('lat')

# annotate points in axis
for idx, row in cameras.iterrows():
    ax.annotate(row['labels'], (row['lon'], row['lat']) )
# force matplotlib to draw the graph
plt.show()
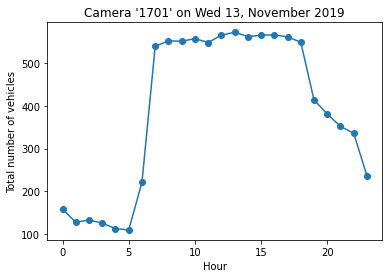
3.2Total number of vehicles per hour captured by a single camera
Let's plot the total number of vehicles per hour captured by camera 1701. To do so, we have processed
a file with images retrieved every 5 minutes on Wed, November 11, 2019.
#Import libraries
import pandas as pd
import matplotlib.pyplot as plt

#Read csv file from Dropbox as Pandas DataFrame
csv = 'https://www.dropbox.com/s/qqncxtpnv83r8ex/1701Wednesday.csv?dl=1'
df =  pd.read_csv(csv,delimiter=',')
We need to select only objects that are of class 3 (cars), 6 (truck) or 8 (bus). We take advantage of
the datetime module that converts timestamps into datetime format, so we can extract days, hours, minutes, etc
df  = df.loc[ (df['Detection_Class']==3) |
              (df['Detection_Class']==6) |
              (df['Detection_Class']==8) ]   #Subset objects that are only vehicles
#Convert todatetime object
df['Timestamp_sg_time']= pd.to_datetime(df['Timestamp_sg_time'])
df['hour'] = df.Timestamp_sg_time.dt.hour  #Extract hour of the day
df['ones'] = 1            #Ones to sum up the total number of vehicles

df_plot = df[['hour', 'ones']]
#Aggregate hour of the day and total number of cars
df_plot = df.groupby(['hour']).agg(vehicles=('ones', 'sum')).reset_index()
We plot the data by running the following lines:
plt.plot(df_plot['hour'], df_plot['vehicles'], "-o")
plt.title("Camera '1701' on Wed 13, November 2019")
plt.xlabel("Hour")
plt.ylabel("Total number of vehicles")
plt.show()
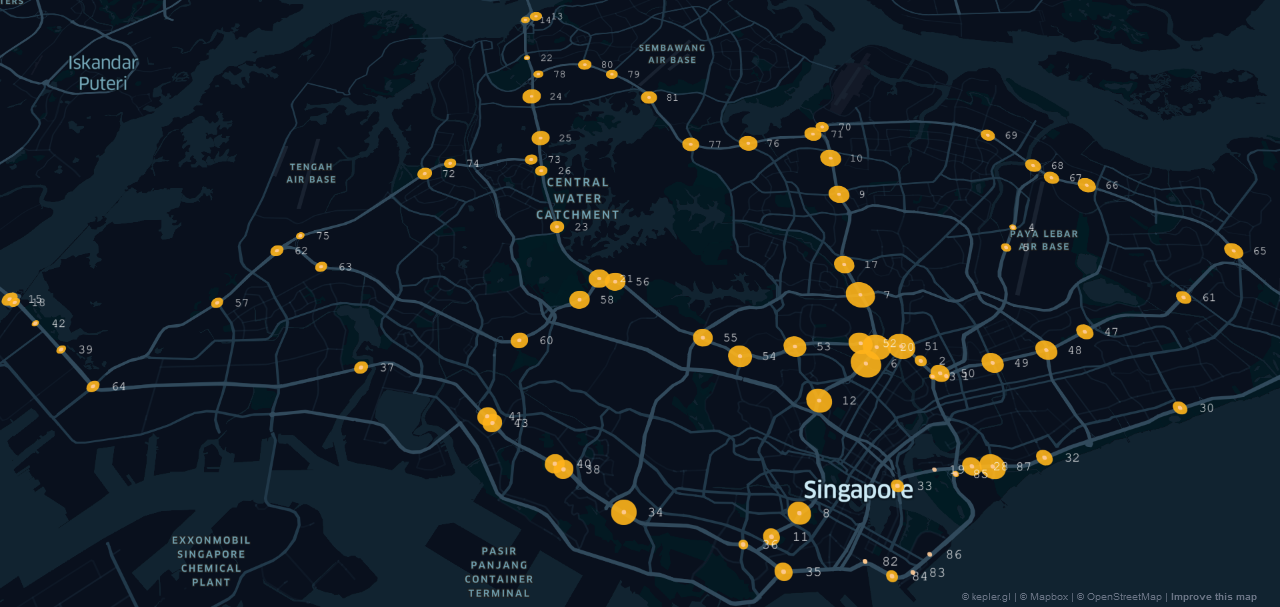
3.3 Advanced visualizations
The following map was created in kepler.
It displays the cumulative number of vehicles (represented by the size of the circles) captured by all cameras on Wed 13,
November 2019. The labels corresponds to the column row_number of the dataset containing the location of the speed cameras.
Kepler is Uber's answer to geospatial analytics. Open-sourced in 2019 it was built with the end-user in mind,
creating a 'drag n' drop' system, being able to analyze millions of points in an instant.
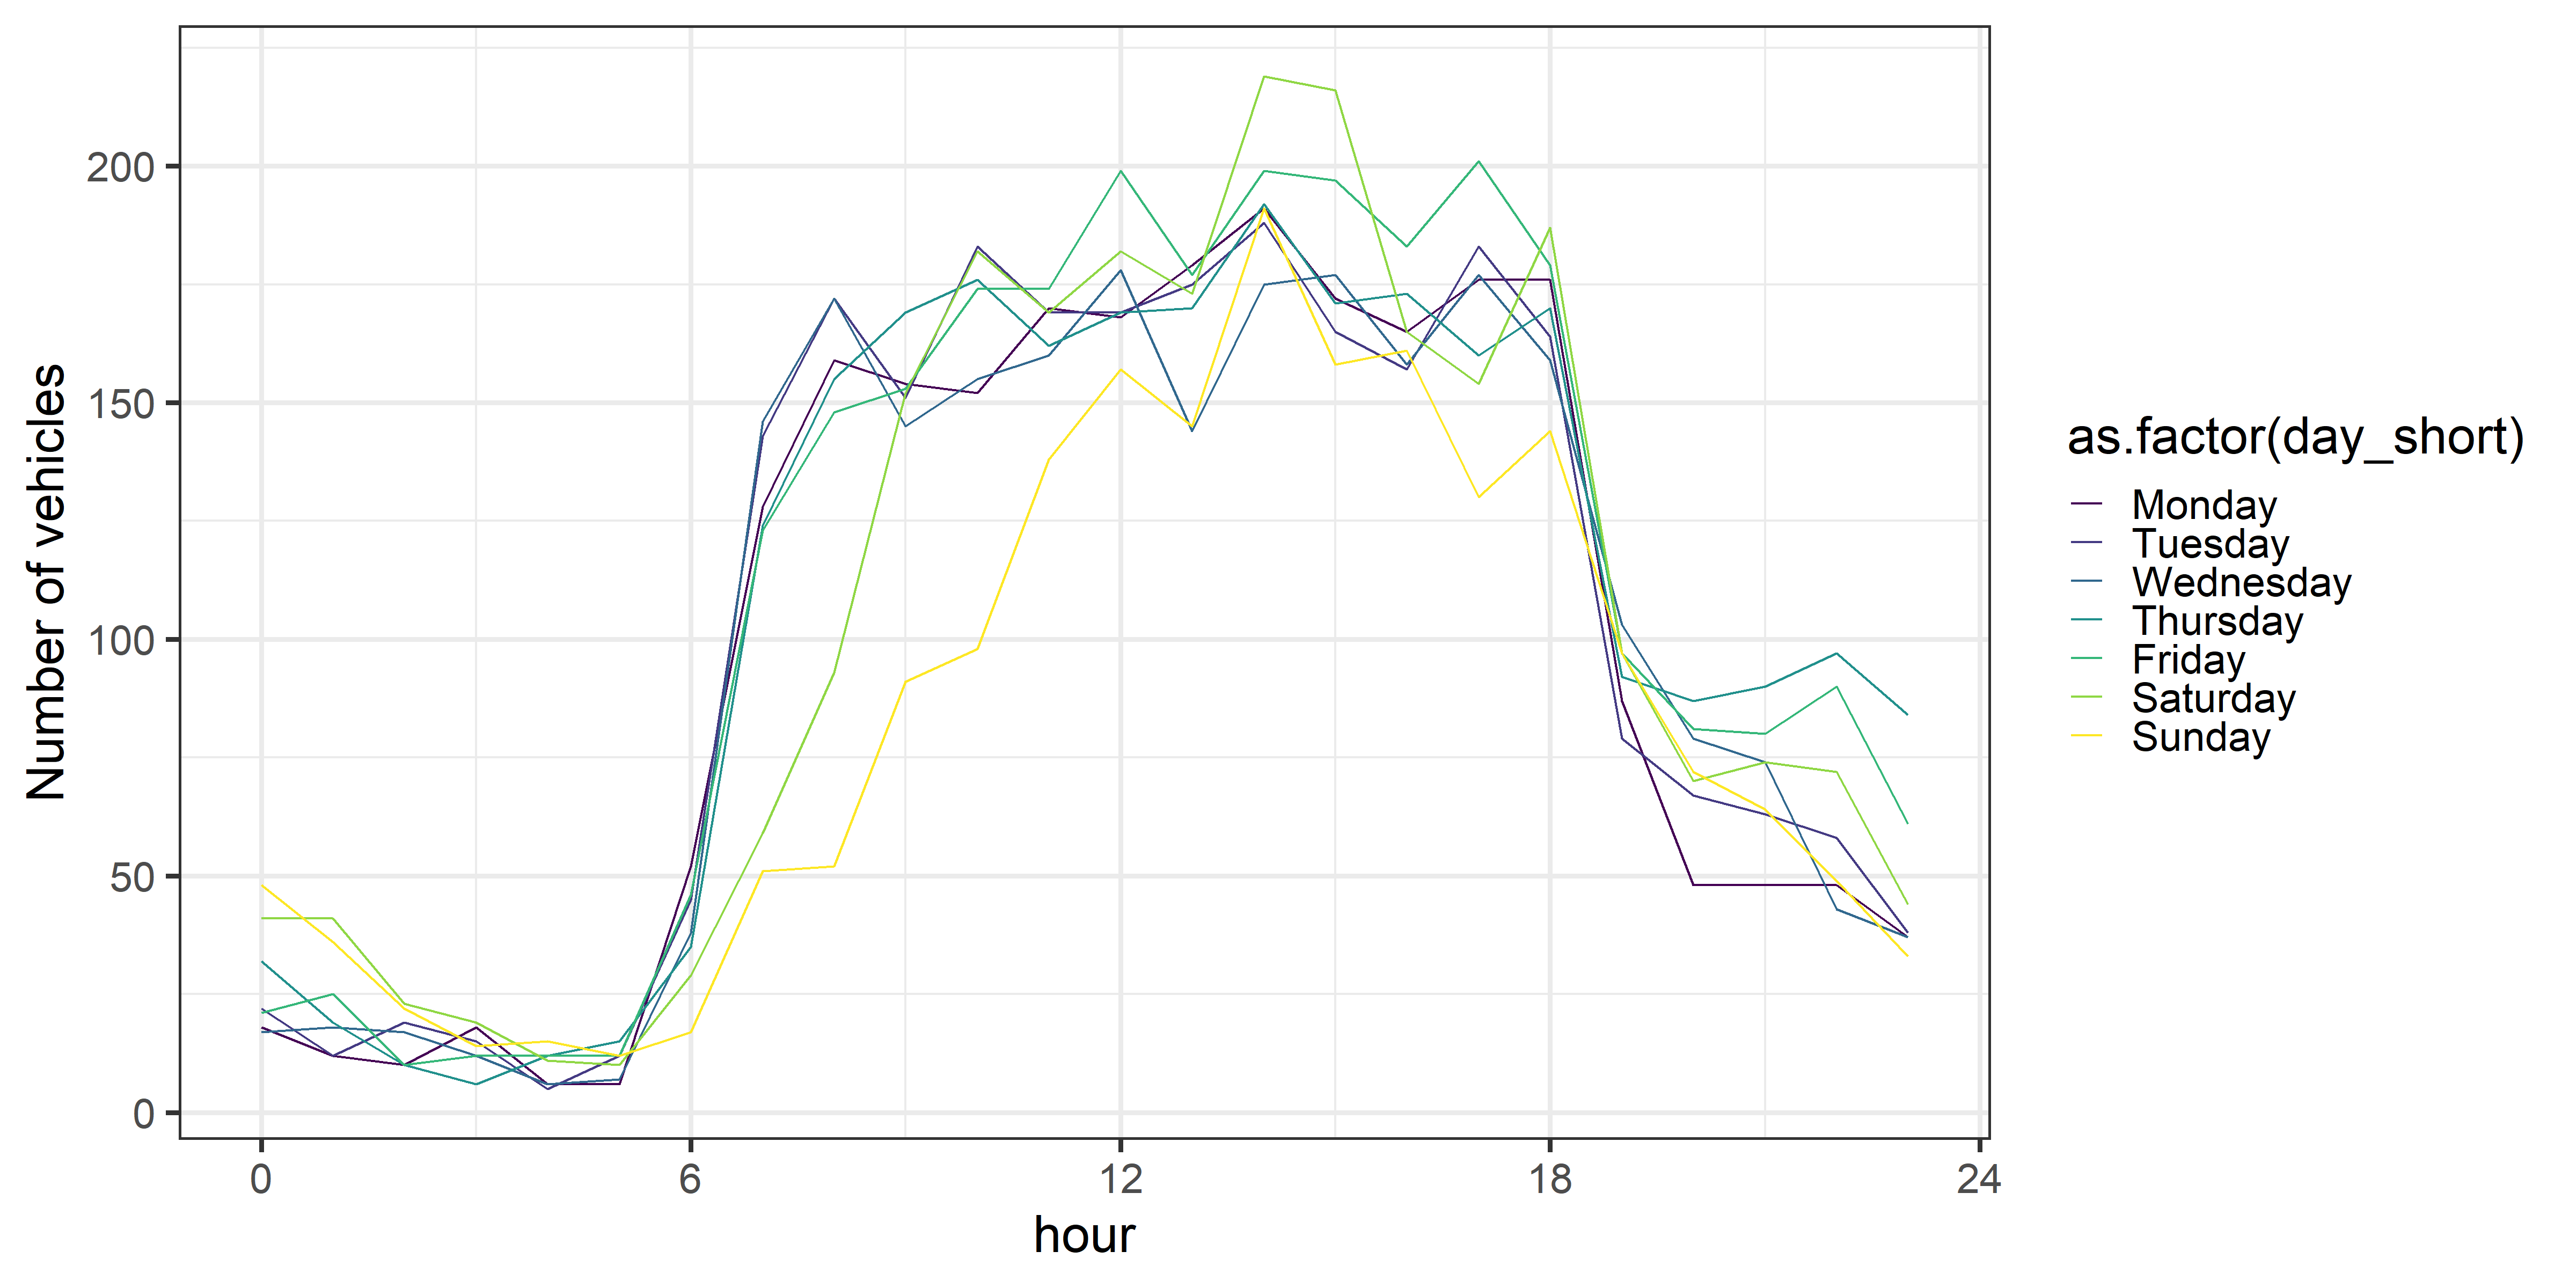
The following plot was created in R. It shows the total number of vehicles between Mon 11 - Sun 17, November 2019
captured by camera 1701. We have droped objects with accuracy less than 0.75.
Interestingly, traffic patterns do not change much between weekends and weekdays.
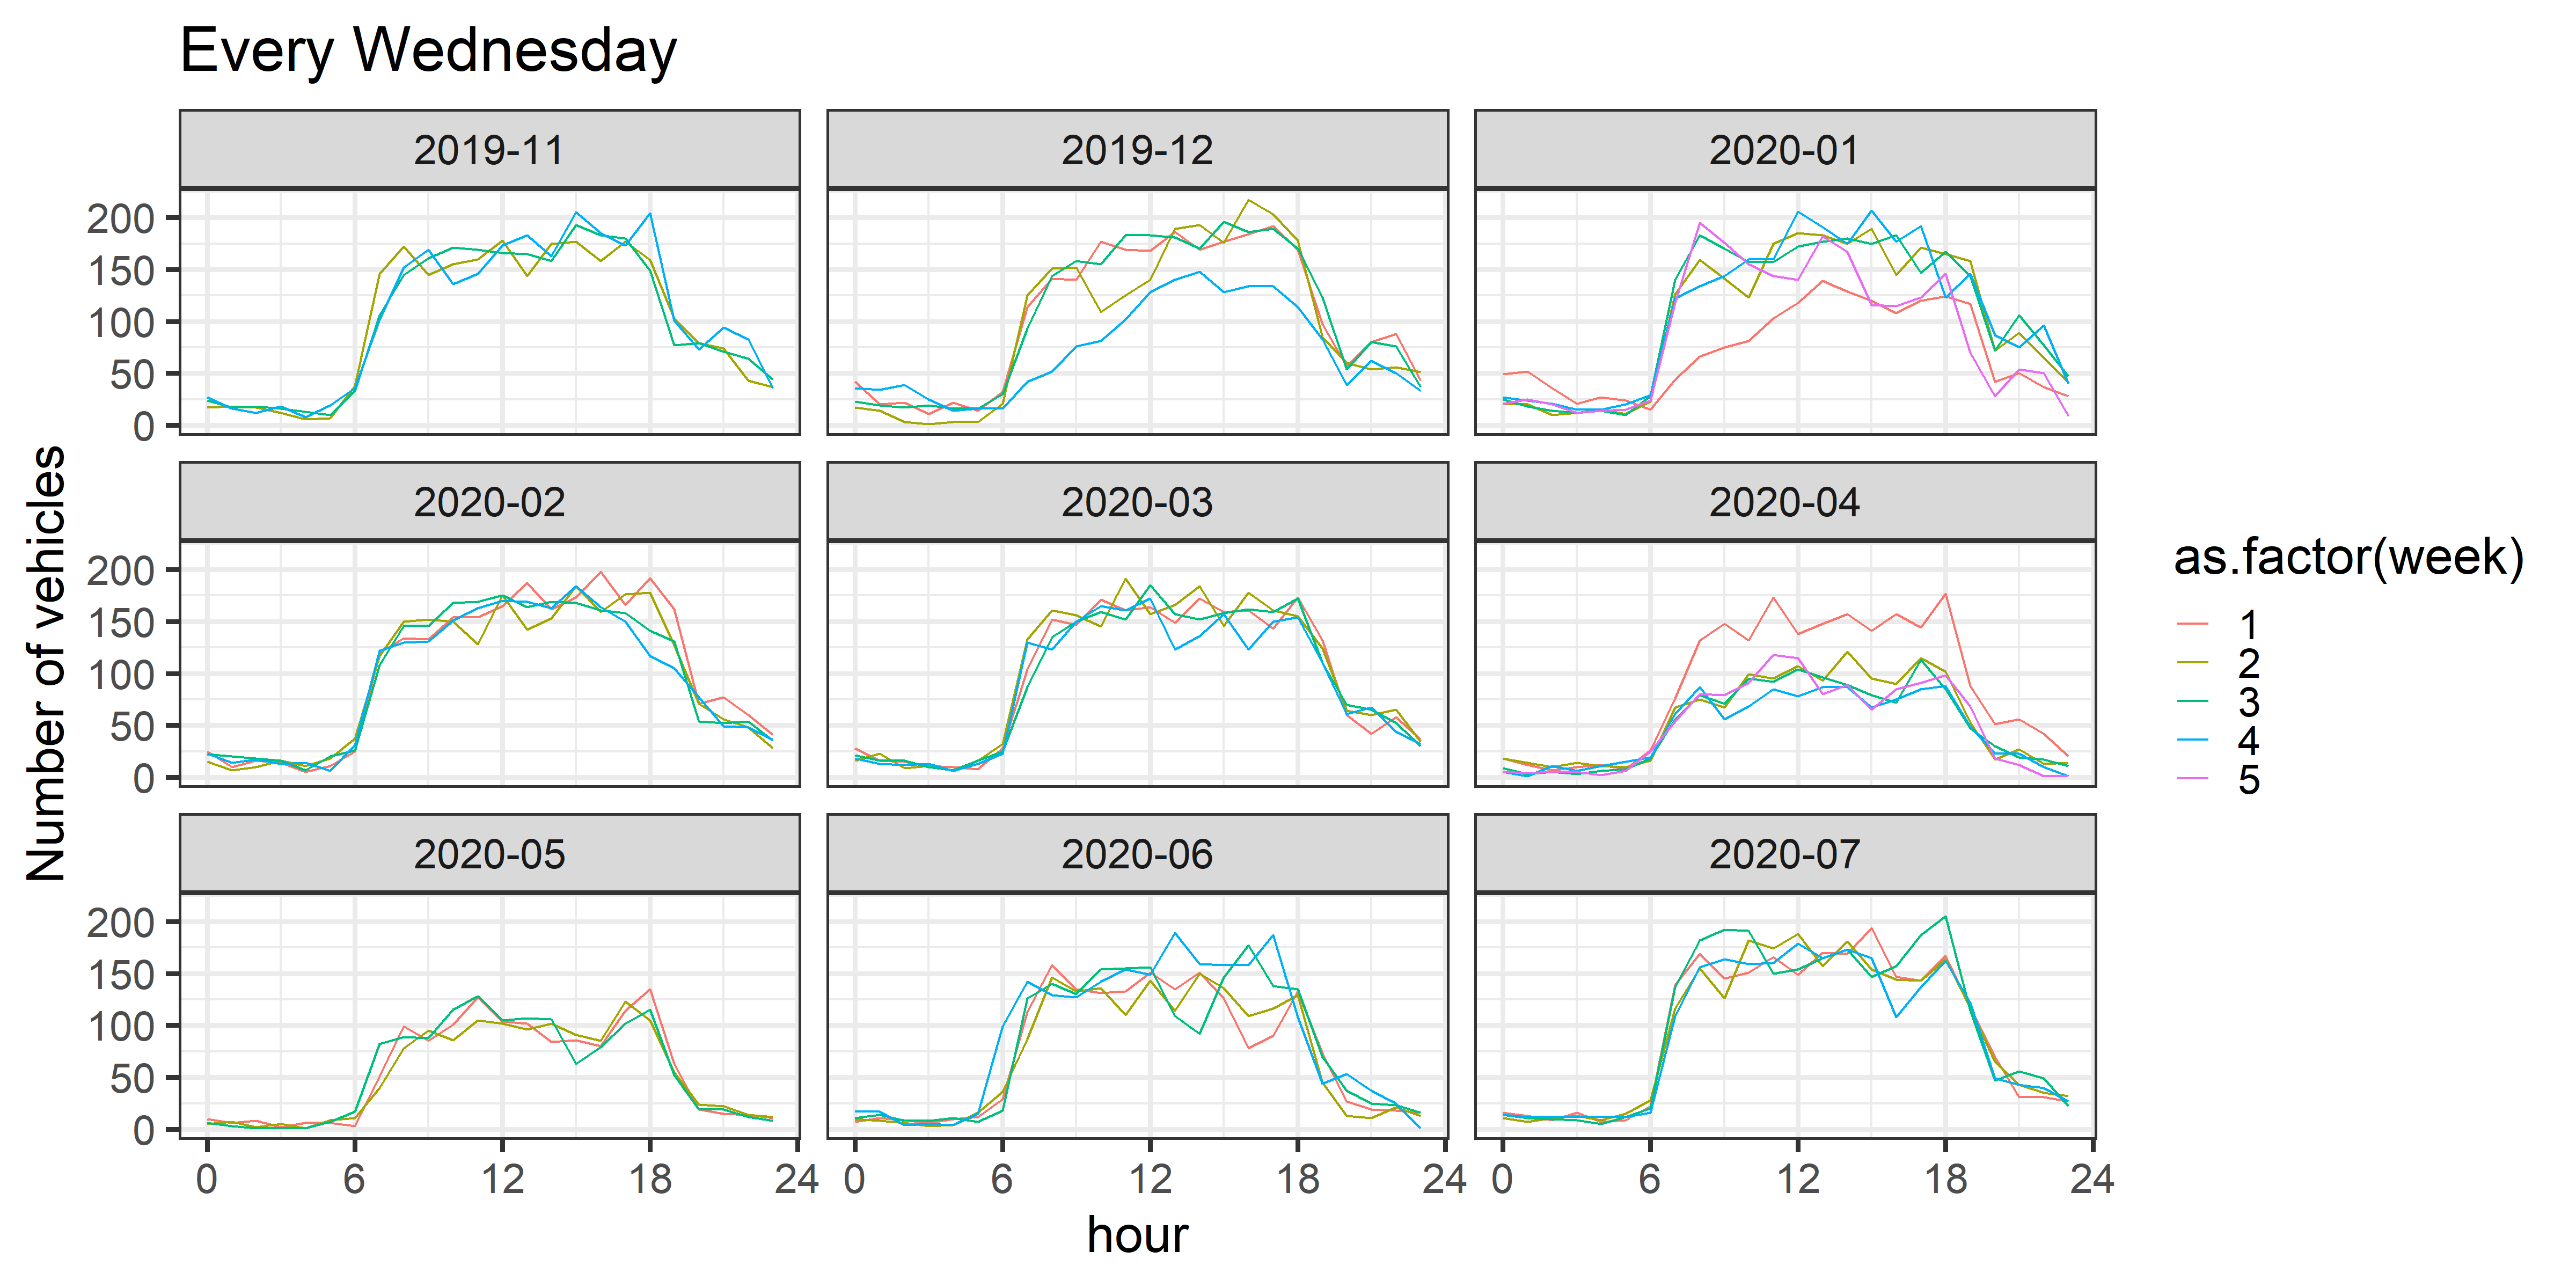
Lastly, let's plot the total number of vehicles captured by camera 1701 every Wednesday between November 2019 and July 2020.
We have droped objects with accuracy less than 0.75.
We can notice a decrease in traffic flow during 2020 Singapore circuit breaker measures (3 April - 1 June, 2020).
You can try to run the code in the following Notebook.