Unveiling the Pedestrian Network
Now that we have defined the geographical boundaries of our city using the boundary files, the next step is to extract the pedestrian network within this defined area. This is where the real exploration of walkability begins!
Extracting Pedestrian Networks
The following Python function, extract_pedestrian_network(gdf, PEDESTRIAN_NETWORK_FILE), performs the key operation. It takes the GeoDataFrame containing the city's boundary (gdf) and a file path to save the resulting pedestrian network (PEDESTRIAN_NETWORK_FILE).
# Plot the pedestrian network
def extract_pedestrian_network(gdf):
	# Extract the multipolygon geometry from the GeoDataFrame
	p = gdf['geometry'].iloc[0]

	#  Download and extract pedestrian within the boundaries of the multipolygon using OSMnx
	G = ox.graph_from_polygon(p, network_type='walk', simplify=True)

	# Plot the pedestrian network using OSMnx's plot function
	fig, ax = ox.plot_graph(G, edge_linewidth=0.1, node_size=0.1)

	# Uncomment the following line if you want to save the pedestrian network locally in a GeoPackage file
	#Note the below operation takes very long time to execute
	# pedestrian_output_path = '/content/pedestrian_network.gpkg'
	# ox.save_graph_geopackage(G, pedestrian_output_path)

	# Return the pedestrian network graph
	return G

# Call the function with the GeoDataFrame and the file path for saving the pedestrian network
G = extract_pedestrian_network(gdf)
Let's break down the code:
In this function, we start by extracting the multipolygon geometry from the GeoDataFrame representing the city's boundary.
Using the osmnx library, we then download and extract the pedestrian network within the specified boundary.
The resulting network graph (G) contains information about walkable pathways and intersections.
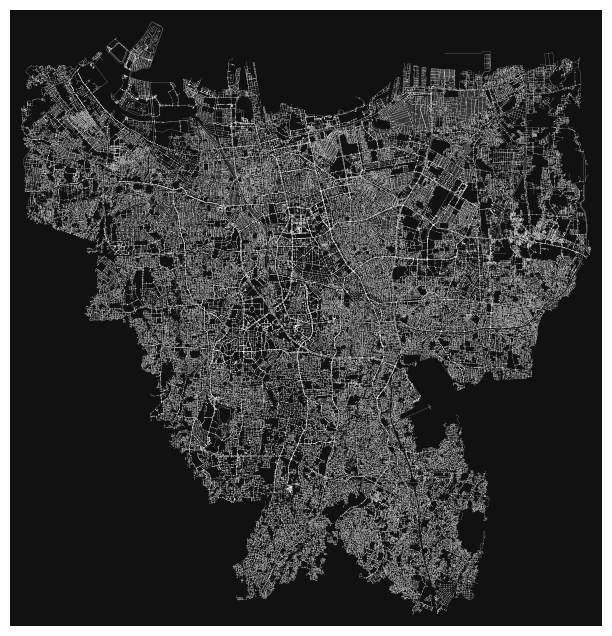
Visualizing the Pedestrian Network
To provide a quick visual overview, we use the ox.plot_graph function to plot the pedestrian network. Adjustments can be made to customize the visualization according to specific preferences.
Examining the Pedestrian Network
Let's delve into some basic information about the network. This information includes the number of nodes, edges, and key attributes that characterize the walkability features within the city limits.
The following Python code snippet provides insights into the characteristics of our pedestrian network:
# Print basic information

print(f"Number of nodes: {G.number_of_nodes()}")

print(f"Number of edges: {G.number_of_edges()}")

print(f"Graph attributes: {G.graph}") # Shows the projection epsg:4326

# We can even convert the nodes and edges as GeoPandas dataframes to inspect the Attribute tables:

nodes_gdf = ox.graph_to_gdfs(G, edges=False)

# Convert edges to a GeoPandas DataFrame

edges_gdf = ox.graph_to_gdfs(G, nodes=False)